


Open your last agency report. Count how many numbers on it would actually change a decision you make this week.
Most won’t. Impressions, reach, followers, even “engagement rate” climb and fall every month without ever touching the question that matters: did the business make more money because of this work.
Why Most Agency Reports Are Theater
A report exists to answer one question. Is this working. Most reports answer a different question: did anything happen. The two look similar and aren’t, and the gap between them is where a lot of marketing budget in Greece quietly disappears.
Two million impressions and zero net profit still makes for a busy-looking slide. Reach counts eyeballs, nothing more. Engagement rate mostly measures how easy something was to double-tap, which runs on its own logic that rarely lines up with an actual purchase.
None of these numbers are fake. They’re just easy to make look good, whether or not the business is growing at all.
The 5 KPIs That Actually Matter
Most businesses need a consistent layer of commercial KPIs across every channel. The exact definitions shift with the business model. A lead-generation company reads CAC differently than an ecommerce store does, but the report should always connect marketing activity to acquisition, conversion, revenue, and customer value.
A well-configured ad account and a decent order system already hold most of what’s needed to calculate all five. The barrier is rarely technical. Nobody set the tracking up correctly at the start, and nobody has gone back to fix it since.
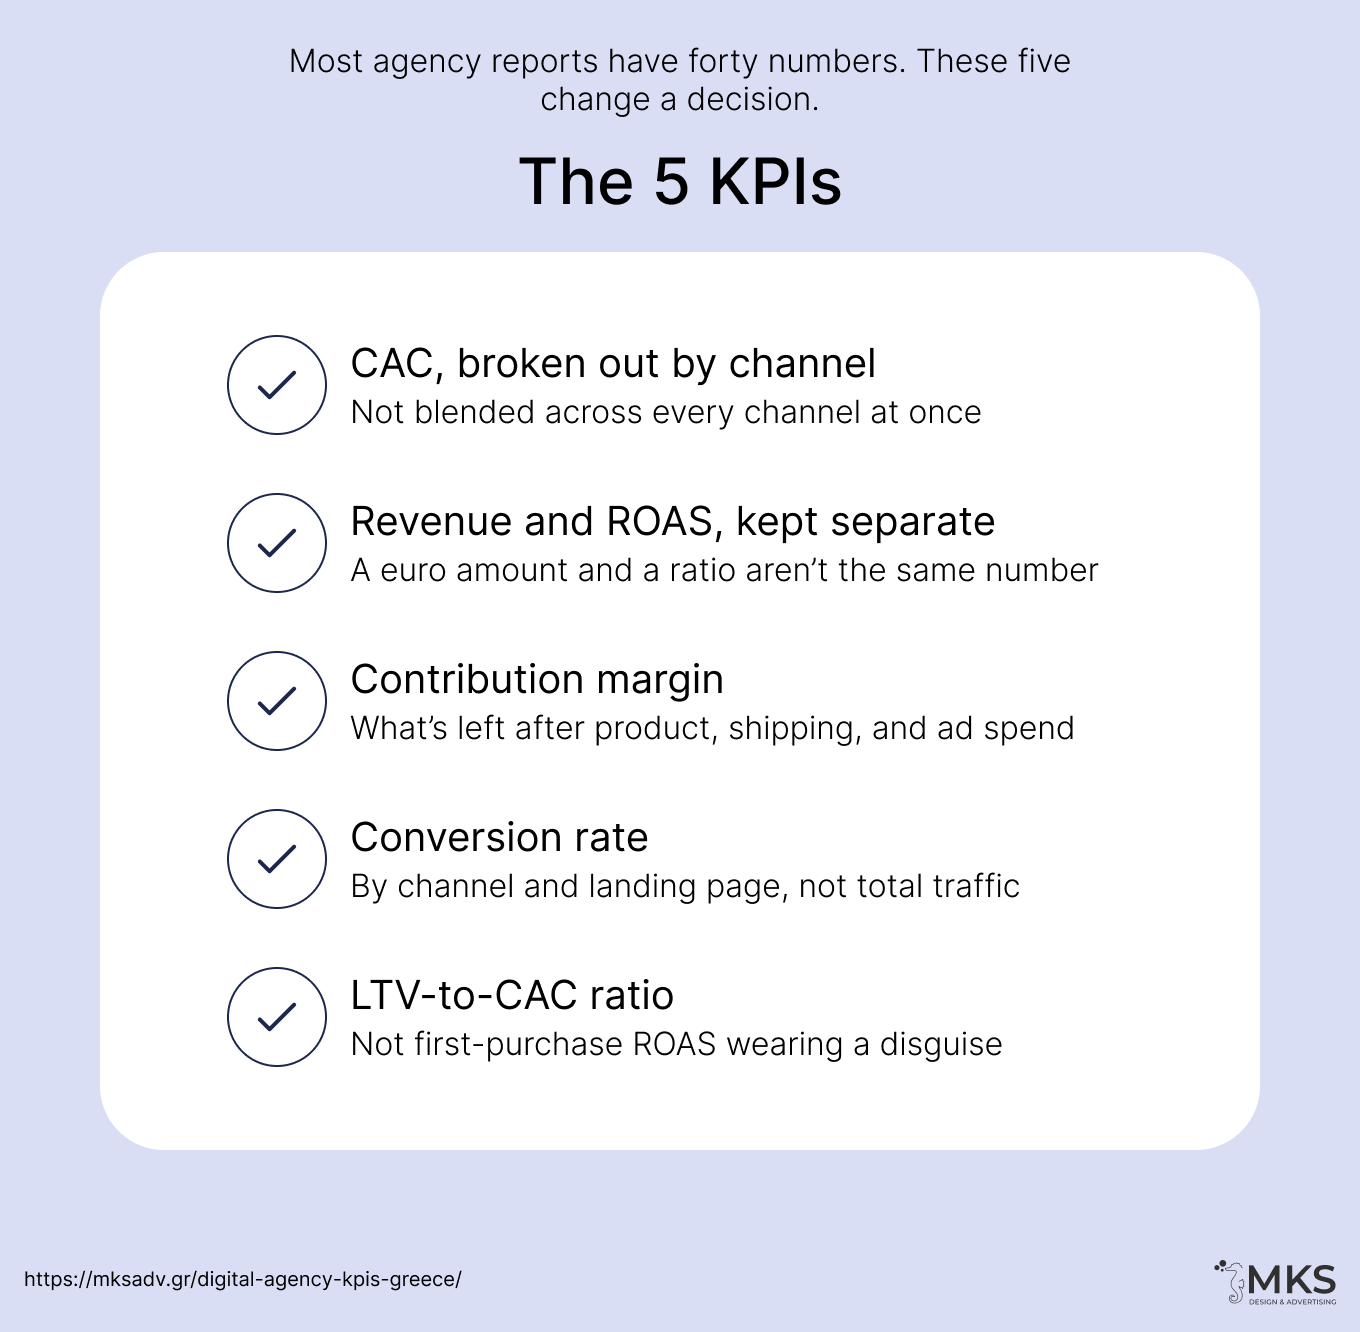
1. Customer acquisition cost, by channel
Channel by channel, not blended across everything. A blended number hides the one channel quietly burning money while another carries the account. Google Ads costing forty percent more per customer than organic search this month won’t show up in a blended figure. Split the two apart and it shows up immediately.
Say a store spends 3,000 euros on Google Ads and gets 60 customers, another 3,000 on Meta and gets 30. Blended, that’s 66 euros per customer, and it looks fine. Split by channel: Google Ads runs 50 euros, Meta runs 100. That’s a real decision about where next month’s budget goes, one blended CAC hides completely.
2. Marketing-attributed revenue and ROAS
This only means anything once conversion tracking is actually set up correctly, which is where most Greek accounts quietly break. Google’s own guide to conversion tracking is worth checking your agency’s setup against before trusting either number.
Marketing-attributed revenue is the euro amount. Not total company revenue, and not a sale from a customer who was already buying regardless. ROAS is a ratio, total conversion value divided by total ad spend, and the two get treated as interchangeable more often than they should. A store spending 10,000 euros and generating 42,000 euros in marketing-attributed revenue has a 4.2x ROAS.
A strong ROAS is not the same as a profitable one. 4.2x can be excellent for a high-margin service business and a loss for a low-margin retailer carrying heavy discounts, shipping cost, and returns. Read ROAS next to margin, never on its own.
3. Contribution margin after marketing
Revenue, ROAS, and CAC can all look healthy while the business loses money. Contribution margin subtracts the direct cost of making and shipping the sale, plus the marketing spend that produced it, from revenue, and shows what’s actually left over. It catches a campaign that sells well at a price that never covered its own costs.
A rough version works without finance software: take revenue, subtract product and shipping cost, then subtract marketing spend. That’s usually enough to catch a business growing its way toward a loss rather than away from one.
4. Conversion rate, by channel and landing page
Traffic volume without a conversion rate attached is a vanity metric in a good outfit. Ten thousand visitors converting at 0.4 percent is a worse month than two thousand visitors converting at 3 percent. A report leading with the traffic number over the conversion rate is picking the flattering figure over the useful one.
5. LTV-to-CAC ratio, retention-adjusted
A first-purchase-only ROAS can look great while masking a business that loses money on every customer who never returns. Google Analytics’ guidance on measuring customer lifetime value is a reasonable starting point, not the finish line.
GA4 can show lifetime revenue and acquisition-source patterns, but that’s not a full LTV model. A real one usually needs margin, refunds, service cost, and repeat-purchase rate, most of which live in a CRM or order system rather than an analytics tool. What actually belongs on a monthly report isn’t LTV by itself, it’s LTV against CAC. A 3:1 ratio or better is a commonly cited target, though the right number depends on margin and how long customers typically stick around.
Channel Health Metrics: What Explains the Numbers
The five numbers above tell you whether the business is working. They don’t explain why a number moved. That’s a different job, and it belongs in a different part of the report, not competing for one of the five slots.
Organic search and generative AI visibility
A single keyword rank on a single day says almost nothing. The trend over months, pulled from Google Search Console, shows whether the site is actually gaining ground.
Search now includes more than a list of blue links. Being cited inside Google AI Overviews, showing up in AI Mode, and getting mentioned by tools like ChatGPT are related but different things, and none of them are the same metric. Get your agency to define exactly what they mean by “AI visibility” before treating it as a number worth tracking, because right now it’s vague enough to become the next impressions.
Impressions, click-through rate, engagement rate, and reach sit in the same category. They explain the mechanics behind a channel’s performance. None of them belong on the five-number page management sees each month, and none of them should replace CAC, margin, or LTV-to-CAC as the numbers a decision actually gets made from.
Where Reporting Gets Harder in Greece
Greek accounts break in a few specific, repeatable places. Phone leads and in-store sales rarely make it back into an ad platform’s conversion data automatically, which means a hotel taking booking calls or a service business closing deals over the phone needs a CRM or call-tracking layer bridging the two, or CAC and ROAS are both quietly wrong.
Consent banners and cookie restrictions cut into tracking accuracy everywhere, but the gap is often wider here simply because fewer Greek businesses have GA4 and a CRM properly connected to their ad accounts in the first place. A lot of “our numbers don’t add up” conversations trace back to that, not to the platforms themselves.
Businesses selling into both the Greek and international markets add another layer. Currency and customer behavior can differ enough between the two that blending them into one CAC or LTV figure hides more than it reveals. Worth splitting the report by market once revenue from outside Greece is more than a small share of the total.
What a Real Dashboard Looks Like
One page. The same five numbers every month, shown as a trend, with two or three plain-language sentences on what moved and why.
A trend line matters more than any single month. CAC jumping fifteen percent once could be noise, a seasonal blip, one bad week. Four months of CAC climbing in a row is a pattern, and a report that only ever compares this month to last month will hide it until it’s already cost real money.
A report that needs a follow-up call just to know whether the month was good has already failed at its one job.
Raising This With Your Current Agency Without Starting a Fight
Most agencies aren’t hiding these numbers out of bad faith. Plenty built their reporting template years ago and never touched it again. Others simply never told their account managers which numbers matter to a business owner instead of a marketing team.
Ask for one thing at a time. Request channel-level CAC on the next report and watch how they respond. An agency that adds it without friction was probably already tracking it and just wasn’t leading with it. One that gets defensive, stalls, or claims it’s impossible is telling you something.
Give it one reporting cycle before judging. Tracking setups sometimes genuinely need a few weeks to configure, especially if conversion tracking was never built out properly to begin with.
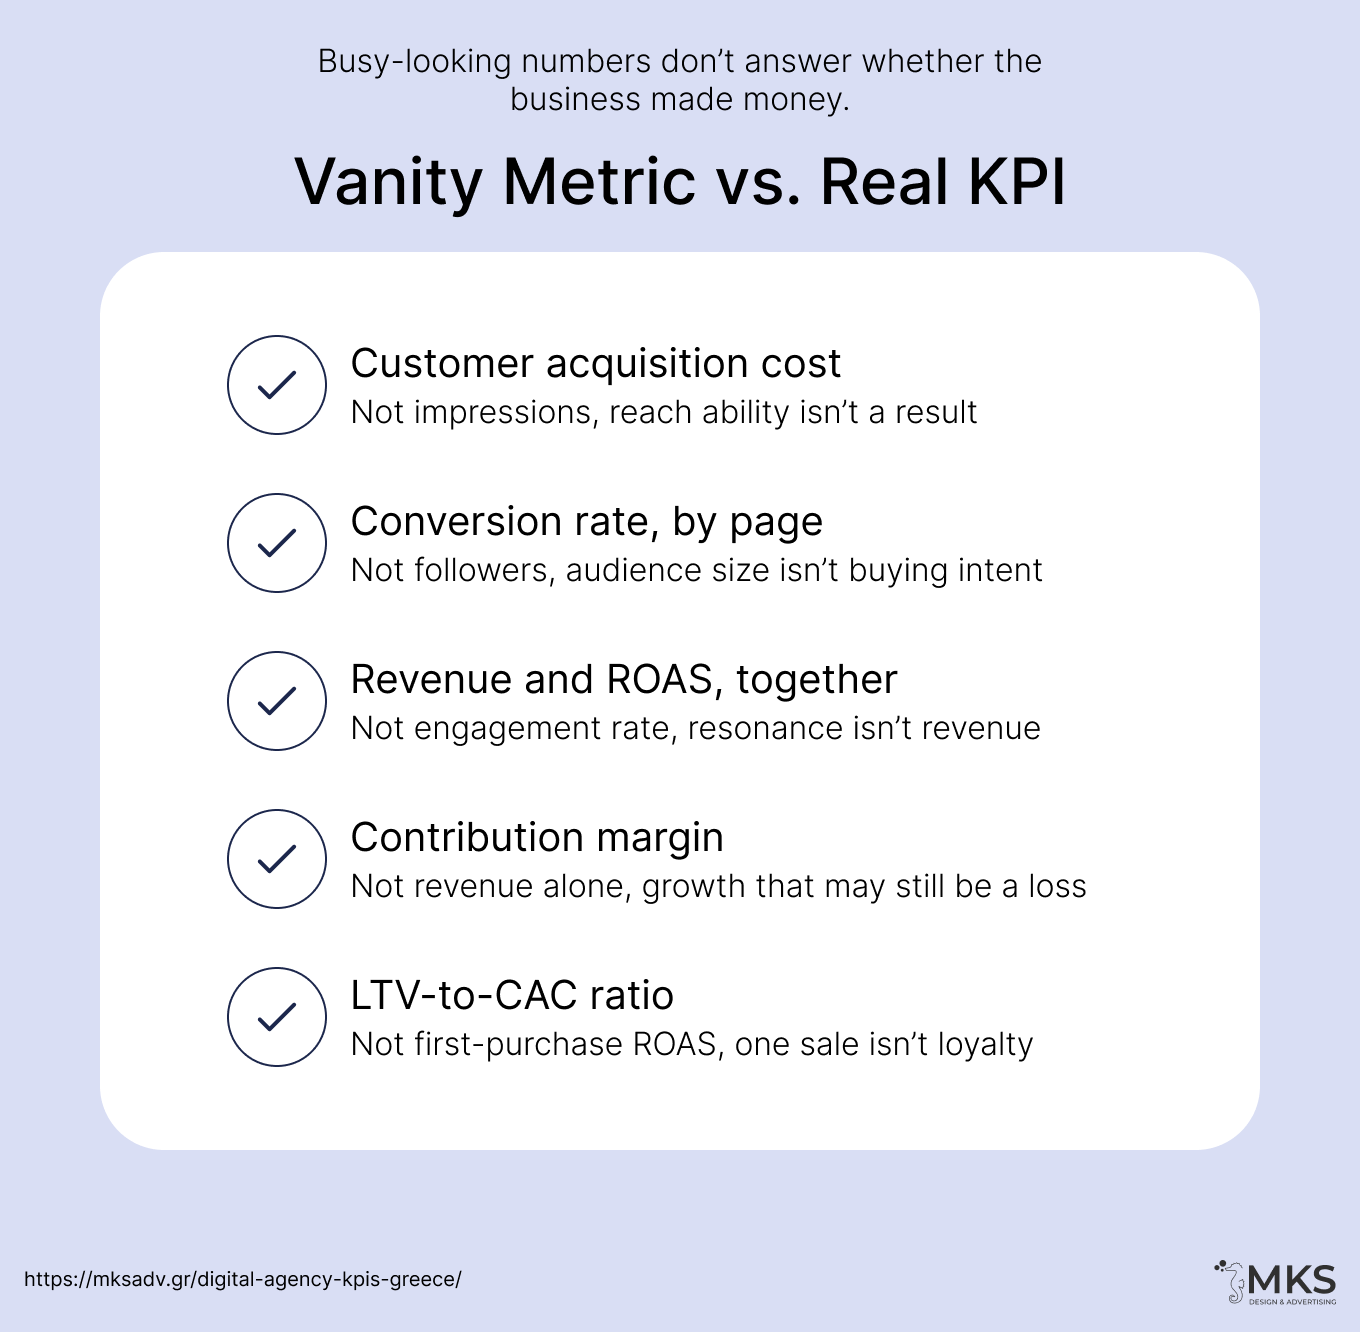
Vanity Metrics vs. Real KPIs
| Vanity metric | What it actually tells you | Real KPI to track instead |
| Impressions | Reach ability, not results | Customer acquisition cost, by channel |
| Followers / likes | Audience size, not buying intent | Conversion rate, by channel and page |
| Engagement rate | Content resonance, not revenue | Marketing-attributed revenue and ROAS |
| Revenue without margin | Growth that may still be a loss | Contribution margin after marketing |
| First-purchase ROAS | One sale, not a relationship | LTV-to-CAC ratio, retention-adjusted |
Frequently Asked Questions
How often should I actually get this report?
Monthly at minimum, with access to the raw data any time you want to check it yourself between reports.
What if my agency says these metrics aren’t available for my industry?
CAC and conversion rate are trackable for nearly any business with an online presence. If they’re genuinely unavailable, that’s usually a sign of a tracking setup problem, not a limitation of the metric itself.
Is a lower CAC always better?
Not if it comes with lower-quality customers who never return. That’s why CAC needs to sit next to LTV, never on its own.
What about brand awareness campaigns, where these KPIs don’t apply as directly?
Even awareness spend should tie back to a downstream CAC or conversion measurement eventually, or there’s no way to know if the awareness turned into anything.
How MKS Approaches Reporting
MKS uses a consistent commercial layer. Acquisition cost, margin, and LTV-to-CAC show up in some form for every client, because a business owner can hold five numbers in their head in a way they can’t hold forty. But the exact metrics and definitions adapt to the business model and to what’s actually trackable. A hotel’s report and an ecommerce report won’t look identical, and they shouldn’t.
Send us your latest agency report. We’ll help you work out which numbers actually support a decision, what’s missing, and where tracking gaps might be quietly distorting the picture.